Report Designer
This section contains information about the basic principles of creating reports with the Report Designer.
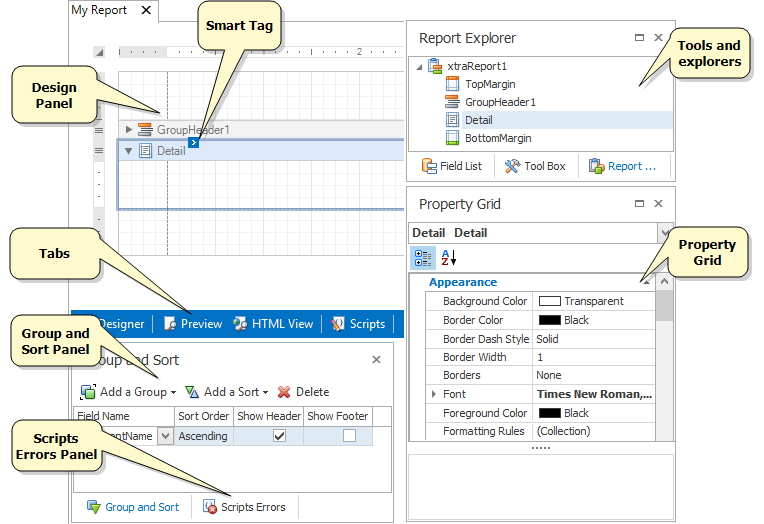
The screenshot below shows an example of a report template being edited in the Report Designer.

The table below describes the main elements of the Report Designer. For more information, see Report Designer User Interface.
| Element | Description |
|---|---|
| Toolbox | Contains controls that you can add to your report by dragging and dropping its icons onto a report's area. |
| Design Panel | A surface where a report is being edited. The Report Designer provides a multi-document interface; you can edit several templates at once. |
| Smart Tag | Most report elements have Smart Tagsthat provide rapid access to the most frequently-used settings. |
| Tabs | Allow you to switch between different modes. For details, see Designer tab, Preview tab, HTML View tab and Scripts tab. |
| Report Explorer | Displays the structure of a report in a visual-tree form, which makes the report navigation easier. |
| Field List | Shows the structure of a report's data source and is used to bind report controls to data. |
| Property Grid | Used to access and modify properties of a report and all its elements (bands and controls). |
| Group and Sort Panel | Allows you to quickly perform grouping and sorting operations throughout a report, and visually represents the report's grouping structure. |
| Scripts Errors Panel | Lists errors found in a report's scripts. Clicking on an error opens the corresponding script section in the Scripts tab. |
